Most dental marketing ROI calculators require a form submission before they show you anything. This one does not. Enter your numbers, get your result immediately, and use the benchmarks below to interpret what the output means for your practice. The calculator below handles three calculations: your simple ROI ratio (production divided by spend), your patient acquisition cost (what each new patient costs to acquire), and your lifetime-value-adjusted ROI (which accounts for the full long-term production value of each patient, not just their first-year revenue). All three numbers together give you a complete picture of whether your marketing investment is working.
ROI Calculator
See your real return on every marketing dollar, updates instantly as you type.
How to Use This Dental Marketing ROI Calculator
The calculator above requires four numbers you should be able to pull from your marketing reports and your practice management software within 10 minutes. Here is exactly where to find each input.
What Inputs You Need Before You Start
Your monthly marketing spend is the total of all marketing-related invoices for the month: agency management fees, Google Ads media spend, Meta Ads spend, SEO service fees, email platform fees, and any other marketing-related software costs. Do not include website hosting or non-marketing software. Your lead count is the total number of inbound patient inquiries attributable to marketing for the month: call tracking software shows you total tracked calls, your website analytics shows form submissions, and your chat platform shows initiated conversations. Your new patient count is the number of new patients who booked and attended an appointment during the month, attributable to marketing channels (use referral source data from your practice management software). Your average first-year production is your total annual production divided by your total new patients for the year, or pull it from your production-per-new-patient report in your practice management software if available.
How to Read Your Results: ROI Ratio, PAC, and LTV-Adjusted Return
Your simple ROI ratio tells you how many dollars in first-year production you are generating for each dollar of marketing spend. A 4:1 ratio means $4 in production for each $1 spent. This is the most useful month-to-month comparison metric. Your patient acquisition cost tells you what you are paying to put each new patient in your chair. Compare this against industry benchmarks ($150 to $300 for general dentistry, $300 to $600 for specialty) to assess whether your CPA is at, above, or below market. Your LTV-adjusted ROI tells you the full long-term return on each patient acquisition, accounting for all future production over the patient relationship. This number is almost always significantly higher than the simple ROI ratio and is the correct figure for evaluating whether an investment-heavy marketing channel is worth the cost. The dental patient lifetime value guide shows you how to calculate your LTV if you do not already have this number.
How to Calculate ROI by Channel vs. Total Marketing Spend
For a channel-specific ROI calculation, run the calculator twice: once with total spend and total patients for a blended view, and once with only the spend and patients attributable to a specific channel for a channel-level view. If your call tracking software shows that 14 of your 22 new patients this month came from Google Ads and you spent $2,800 on Google Ads, run the calculator with $2,800 spend and 14 patients to get your Google Ads-specific PAC and ROI. The difference between your blended ROI and your channel-level ROI shows you which channels are pulling the overall average up and which are dragging it down. The full dental marketing ROI framework covers the channel-level attribution methodology that makes this calculation accurate.
What the Numbers in Your Results Actually Mean
The calculator produces numbers. Interpreting those numbers correctly requires context: what is the benchmark, why does the LTV-adjusted ratio matter more than the simple ratio, and what should you do when the result is below benchmark?
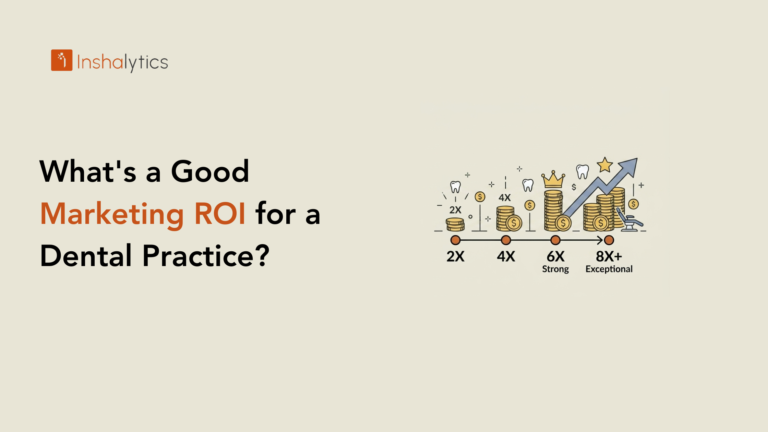
What Is a Good Dental Marketing ROI? Industry Benchmarks Explained
The American Dental Association and leading dental marketing benchmarking surveys define healthy dental marketing ROI as 3:1 to 5:1 on a first-year production basis. Below 3:1, the campaign needs attention: either spend is too high relative to patient volume, or conversion rates are below benchmark. Between 3:1 and 5:1, the campaign is performing at industry standard and is worth maintaining while optimising toward the higher end. Above 5:1, the channel is performing at an elite level and is a strong candidate for increased budget allocation. Note that these benchmarks apply to first-year production. LTV-adjusted ratios will be 4 to 10 times higher for a well-retained patient base, which is the correct measure of long-term marketing profitability.
Why LTV-Adjusted ROI Tells a Different Story Than Simple Revenue Divided by Spend
A practice that spends $3,000 on marketing and acquires 12 new patients averaging $700 in first-year production generates a simple ROI of ($8,400 minus $3,000) divided by $3,000 = 1.8:1. That number suggests the campaign is underperforming. Those same 12 patients, retained for an average of 8 years at $700 annual production, generate $6,700 in LTV each. Total LTV from 12 patients is $80,400. LTV-adjusted ROI = ($80,400 minus $3,000) divided by $3,000 = 25.8:1. Both calculations are mathematically correct. The simple ROI tells you the current-month cash flow impact. The LTV-adjusted ROI tells you the actual return on the investment. Evaluating dental marketing on simple ROI alone consistently causes practices to underinvest in their most profitable acquisition channels.
When Your ROI Is Low: What to Check First
If your calculator result shows a simple ROI below 2:1, check these in order. First, is your lead count accurate? If you are missing attribution (calls arriving at an untracked number, forms not recording), your lead count is understated, and your actual ROI is higher than calculated. Second, is your patient count correctly limited to marketing-attributed patients? Including referrals or walk-ins in the count inflates patient numbers, but those patients cost nothing to acquire through marketing spend. Third, is your conversion rate (patients divided by leads) above 25%? If it is below 20%, your front desk conversion process is the primary ROI problem, not your marketing channel performance. Each of these checks is free to run, and each regularly reveals that marketing ROI is better than the initial calculation suggested.
What to Do After You Have Calculated Your ROI
The calculator gives you a number. The number implies an action. Here is the decision framework for the most common results.
Channels Worth Scaling vs. Channels That Need Optimisation
A channel delivering simple ROI above 5:1 (or LTV-adjusted ROI above 15:1) is performing at a level that justifies increased spend. The return per additional dollar invested in this channel is positive and the economics suggest budget should move toward it from channels performing below benchmark. A channel delivering simple ROI between 2:1 and 3:1 needs optimisation before budget decisions are made: is it at full evaluation maturity (90 days for Google Ads, 12 months for SEO)? Is the tracking attribution complete? Is the landing page converting at benchmark? Fix these before reducing spend. A channel delivering simple ROI below 2:1 after full evaluation maturity and with complete attribution is a candidate for reallocation. The dental marketing budget guide and local SEO guide cover the channel-specific factors that determine where reallocation should go.
How Often Should You Run This Calculation?
Run the full ROI calculation monthly for each active channel and track the results in a simple spreadsheet month over month. Monthly tracking reveals trends that single-month snapshots miss: a channel whose simple ROI is declining month over month despite stable spend and stable patient volume is showing cost or quality degradation that needs attention before the trend becomes a significant budget problem. A channel whose simple ROI is improving month over month is demonstrating the compounding efficiency effect that justifies continued investment. A quarterly review of LTV-adjusted ROI across channels gives you the long-horizon view needed for annual budget planning and channel mix decisions.
Want Help Improving the Numbers in Your Calculator?
The calculator shows you where you are. Improving the result requires addressing the specific constraint: if your PAC is too high, it is either a CPL problem (leads are expensive) or a conversion rate problem (leads are not becoming patients efficiently). If your simple ROI is below benchmark, it is either a patient volume problem or a production value problem. Each of these has a specific diagnostic approach and a specific fix.
The Tracking Infrastructure That Makes Accurate ROI Calculation Possible
The inputs this calculator requires (accurate lead count, accurate patient count, correct spend by channel) depend on a tracking infrastructure that most dental practices do not have fully in place. Without call tracking software, lead counts are understated. Without referral source data in your practice management software, patient counts cannot be segmented by channel. Without UTM parameters on every ad, channel-level spend cannot be connected to channel-level patients. Inshalytics implements this tracking infrastructure as part of every dental marketing engagement, ensuring that ROI calculations are based on complete data from the first month of measurement. The full methodology is covered in the dental marketing ROI calculation guide.
How Inshalytics Turns Your Marketing Data Into a Monthly ROI Report
Every Inshalytics dental client receives a monthly report that contains the same outputs this calculator shows, plus channel-level breakdowns, trending data month over month, and a specific diagnostic note on any channel performing outside its benchmark range. The report is built from call tracking data, practice management software referral source data, and ad platform performance data combined into a single source. It answers the question every practice owner should be asking: which specific marketing investment generated which specific production revenue this month? If your current marketing reporting does not answer that question, you are making budget decisions without the information needed to make them correctly.
Ready to see what your real dental marketing ROI looks like with complete attribution? Talk to Inshalytics about building the tracking infrastructure and reporting that makes this calculation accurate every month.