The most common marketing question dental practice owners ask is also the hardest to answer with a single number: what is a good ROI? The ADA-cited benchmark of 3:1 to 5:1 return is a starting point, but it masks enormous variation by channel, practice type, market, and measurement method. A 3:1 ROI on a Google Ads campaign targeting general dentistry is acceptable. A 3:1 ROI on a mature local SEO campaign suggests underperformance. A 3:1 ROI on an implant marketing campaign where the CPA is $400 and the average case value is $8,000 means you are significantly underspending. This guide breaks down what “good” actually looks like for your specific situation so you can benchmark accurately and act on the comparison.
What Is a Good Dental Marketing ROI? The Short Answer
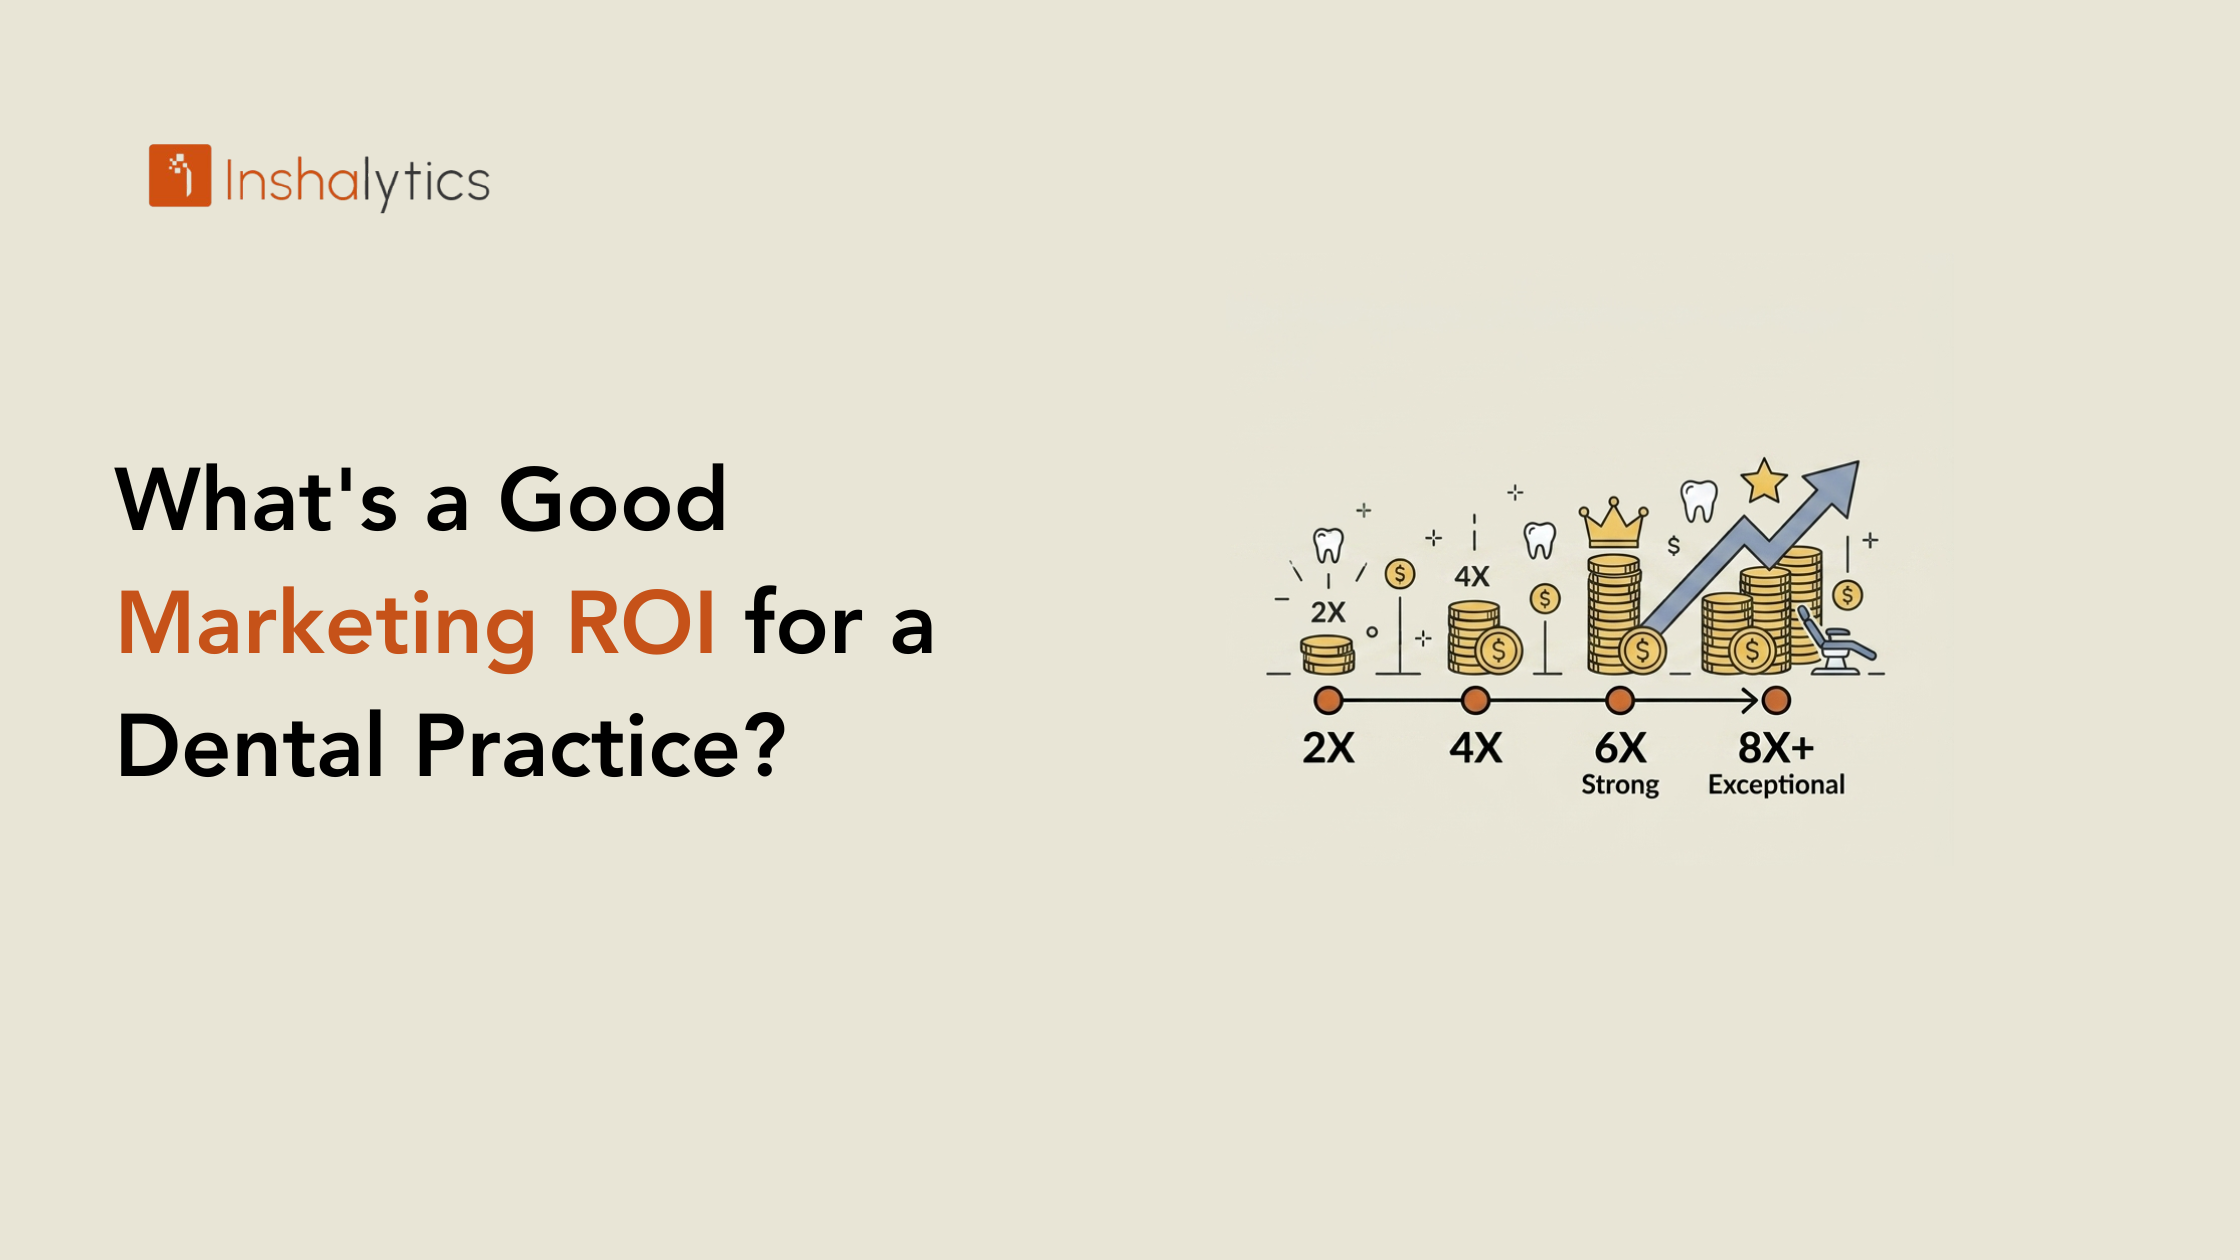
The widely cited benchmark for dental marketing ROI is a 3:1 to 5:1 return ratio, meaning every dollar spent on marketing generates three to five dollars in patient production revenue. This is the standard referenced by the American Dental Association and affirmed by industry benchmarking surveys. But this number only applies to blended, all-channel ROI for a general dentistry practice of average size in a moderately competitive US market. Below that standard, a campaign needs attention. Above 5:1, the channel is performing at an elite level and is worth scaling.
The 3:1 to 5:1 Industry Benchmark: Where It Comes From
The 3:1 to 5:1 benchmark is derived from average patient lifetime value ($4,000 to $10,400 for a general dentistry patient over 6 to 10 years) against average patient acquisition costs ($150 to $300 through paid digital channels). At a $200 PAC and a $6,000 LTV, a practice acquires patients at a 30:1 lifetime ratio, but first-year production per patient averages $600 to $1,200, which is what produces the 3:1 to 5:1 first-year ROI figure. The full dental marketing ROI calculation framework covers how to apply this correctly to your own numbers.
Why a Single Benchmark Number Misleads Most Practice Owners
Applying a single 3:1 to 5:1 benchmark across all channels and all practice types produces incorrect conclusions. Local SEO campaigns that have been running for 18 months should deliver 8:1 to 12:1 ratios because the cost per patient acquisition drops as rankings mature. Google Ads campaigns targeting implant keywords may deliver 4:1 ROI ratios based on first-year production but 20:1 ratios on LTV-adjusted calculations because implant patients have high long-term practice value. Email marketing to existing patients should deliver 10:1 or higher because the media cost is near-zero. Judging each of these by the same 3:1 to 5:1 benchmark causes practices to cut their best channels and retain their worst.
The Three Variables That Change What Good Looks Like for Your Practice
Your ROI benchmark should adjust for three variables. First, practice type and treatment mix: a cosmetic and implant practice has a fundamentally different per-patient production profile than a general dentistry practice, which changes what acquisition costs are acceptable. Second, market competition: practices in highly competitive metro markets see higher CPLs and therefore lower short-term ROI ratios than practices in less competitive suburban markets. Third, campaign maturity: a newly launched Google Ads campaign in its learning phase should not be held to the same ROI standard as a campaign that has been running and optimising for 18 months.
Dental Marketing ROI Benchmarks by Channel (2026)
The following benchmarks are drawn from industry data and reflect the expected ROI range for each channel at the performance levels achievable by a well-managed dental marketing program in the US market in 2026.
Google Ads ROI Benchmarks for Dental Practices
Google Ads for dentists typically delivers a first-year ROI of 3:1 to 6:1 for general dentistry and 4:1 to 10:1 for high-ticket treatments like implants, Invisalign, and cosmetic cases. CPC for general dental keywords runs $5 to $15. High-intent keywords like “dental implants near me” run $25 to $60 per click in competitive markets. A well-structured campaign with a conversion-optimised landing page generates a CPL of $45 to $135 for general dentistry. If 30% of those leads convert to patients and each patient generates $800 in first-year production, the ROI ratio at $90 CPL and 30% conversion is approximately 2.7:1 on first-year production alone. Factor in LTV of $8,000 per retained patient and the lifetime ROI becomes 30:1+. See dental Google Ads strategy for the campaign type breakdown.
Local SEO ROI Benchmarks: Short-Term vs. Long-Term
Local SEO delivers the most variable ROI by time horizon of any dental marketing channel. In months 1 to 6, while rankings are building, attributed patient volume is low and ROI appears weak. At month 12, when organic rankings are established for primary keywords like “dentist near me” and “dental implants ,” a well-executed SEO program typically delivers $5 to $12 in production for every dollar of SEO spend, a 5:1 to 12:1 ratio. At month 24, as rankings compound and branded search volume grows from review and referral activity, the ratio often reaches 15:1 to 20:1 because the monthly SEO investment cost has remained flat while the organic patient flow has grown. This compounding is the most powerful ROI dynamic in dental marketing. The local SEO guide for dental practices explains the ranking factors that determine how fast this compounding begins.
Email Marketing ROI Benchmarks for Dental
Email marketing to an existing dental patient list delivers the highest short-term ROI of any channel when applied to reactivation and recall campaigns. Industry benchmarks show email delivering $36 to $42 for every dollar spent across industries. For dental practices specifically, where a single reactivated patient completing overdue treatment may generate $400 to $2,500 in production, the ROI on a reactivation campaign can exceed 50:1 when the cost of the email platform and send is compared against the production generated. The limitation is audience size: email only reaches existing or previously existing patients, making it an ROI multiplier on retained patients rather than a new patient acquisition channel.
Social Media ROI Benchmarks: What Realistic Looks Like
Organic social media does not generate direct attributable ROI in most dental marketing programs. Its contribution is awareness and trust-building that improves conversion rates from other channels. Paid social (Facebook and Instagram ads) generates measurable leads for practices running before-and-after creative for cosmetic and implant treatments. Benchmarks for paid social dental campaigns run $35 to $90 per lead for general dentistry and $65 to $150 per lead for speciality treatments. The lower lead cost compared to Google Ads is offset by a lower lead intent level and a longer average time to conversion, making paid social ROI best evaluated at 90 to 120 days rather than 30.
Dental Marketing ROI Benchmarks by Practice Type
Practice type is the single largest variable in dental marketing ROI benchmarks. The treatment mix determines the per-patient production value, which determines what acquisition costs are justifiable and what ROI ratios are realistic.
General Dentistry: Volume Model Benchmarks
A general dentistry practice competing on a volume model (high patient throughput, insurance-driven, focus on hygiene and standard restorative) typically targets a blended marketing ROI of 3:1 to 5:1 on first-year patient production. With an average first-year patient value of $600 to $1,200, the maximum justifiable PAC for a profitable acquisition is $120 to $400. The most efficient channels for this practice type are local SEO (lowest per-patient cost at maturity), Google Ads for emergency and “dentist near me” intent, and email recall for existing patients.
Implant and Cosmetic Practices: High-Ticket ROI Math
An implant or cosmetic dentistry practice operates on fundamentally different ROI math. A single full-arch implant case generates $15,000 to $30,000 in production. A cosmetic smile makeover generates $8,000 to $25,000. At these production values, a PAC of $500 to $2,000 per patient is entirely justifiable, producing a 10:1 to 30:1 first-case ROI even before accounting for patient retention and LTV. This means implant and cosmetic practices can profitably spend more per lead, which allows them to compete aggressively on Google Ads for high-intent keywords where CPCs of $25 to $60 represent strong value against a $12,000 average case value.
New Practices vs. Established Practices: Why Benchmarks Differ
New practices (under 3 years old) face a different ROI profile than established practices. They lack the review volume and brand recognition that drives organic trust; they have not yet built the referral flywheel; and they have not established the local SEO authority that delivers low-cost organic patients. New practices should expect a lower ROI ratio in years 1 and 2 while investing at higher-than-average marketing spend levels (8% to 12% of revenue versus the 4% to 7% typical for established practices) to build these compounding assets. The dental marketing budget guide covers the practice-stage framework for budget allocation in detail.
What Does Below-Benchmark ROI Tell You?
A dental marketing ROI below 3:1 is a diagnostic signal, not automatically a signal to cut spend. The problem is rarely that marketing does not work for dental practices. The problem is specific and fixable.
ROI Below 3:1: Diagnosis Framework
When ROI falls below 3:1, work through this sequence:
1. Is attribution correct? Could production revenue be happening that is not being attributed to marketing? If referral source data in your practice management software is incomplete, your ROI calculation is understating true returns.
2. Is the front desk converting leads? If CPL is strong but PAC is very high, leads are arriving but not converting to patients. This is an operations problem, not a marketing problem.
3. Is the channel at evaluation maturity? Has this channel had at least 90 days (Google Ads) or 12 months (SEO) to reach optimised performance?
4. Is the channel-to-audience match correct? A premium implant practice running generic “dentist near me” Google Ads is targeting the wrong audience for its treatment mix.
When Low ROI Is a Tracking Problem, Not a Marketing Problem
Many dental practices that report poor marketing ROI are actually generating positive returns that their tracking system cannot see. If patients are calling the main practice number rather than a tracked campaign number, those conversions are invisible to the reporting. If referral source fields in the practice management software are blank, production from marketing-acquired patients is not attributed. Before concluding that ROI is genuinely low, audit whether the tracking infrastructure is capturing the full attribution picture. The dental marketing mistakes guide covers attribution failure as one of the most expensive and most common problems in dental marketing.
When Low ROI Signals a Front Desk Conversion Issue
According to benchmarks, the average dental practice answers only 66% of inbound calls from prospective patients. Each missed call at a CPL of $80 represents $80 in wasted marketing spend and a lost patient worth $4,000 to $10,000 in LTV. If your marketing is generating qualified leads but your PAC is dramatically higher than your CPL would predict, the conversion failure is between lead and booked appointment. Training the front desk on call handling, implementing missed-call text-back, and reviewing call recordings are the highest-ROI interventions in this scenario.
How to Use Benchmarks to Set Your Marketing Budget
Benchmarks are most useful when used in reverse: work backwards from your ROI target to determine what budget is justified, rather than setting an arbitrary budget and hoping the ROI follows.
Working Backwards From Your ROI Target to Your Budget
If your practice wants to acquire 15 new patients per month and your blended PAC across channels is $200, your monthly patient acquisition budget is $3,000. If your target is a 5:1 ROI on first-year production of $900 per patient, you need to generate $13,500 in attributed production to justify that $3,000 spend. This backwards calculation makes the budget discussion concrete rather than percentage-based, and it ties the marketing investment to a specific production goal rather than an industry percentage rule.
How Inshalytics Sets and Reports Against ROI Benchmarks for Each Client
At Inshalytics, every dental client engagement begins with a benchmark calibration: what is the realistic ROI target for this practice type, at this market competition level, with these specific channels, at this stage of campaign maturity? We do not apply a single 3:1 standard across all clients because a 3:1 benchmark is correct for one client and conservative for another. Monthly reports show actual ROI against the calibrated benchmark, with a diagnostic note on any channel performing below its target. This gives the practice owner a clear, contextualised view of marketing performance rather than a number to compare against an industry average that may not apply to their situation.
Want to know what ROI benchmark applies to your practice specifically? Talk to Inshalytics about a calibrated performance assessment for your market and treatment mix.