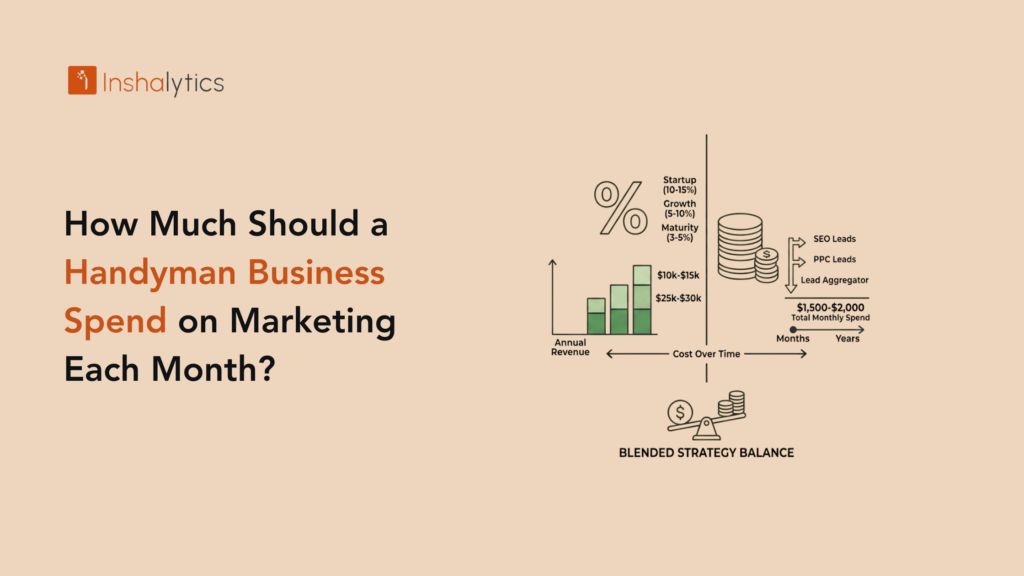
There is a common rule of thumb that businesses should spend 5% to 10% of revenue on marketing. For a handyman business doing $150,000 per year, that is $625 to $1,250 per month. That range might be right for your situation or it might be exactly wrong, because the right marketing spend for a handyman business depends on five variables that a percentage-of-revenue rule does not account for: your revenue goal, your current lead volume, your average job value, your current marketing mix, and whether you are trying to maintain current revenue or grow it. This guide covers how to calculate the right monthly marketing budget for your handyman business based on your specific numbers rather than a generic industry average.
Why Percentage-of-Revenue Rules Are an Incomplete Guide
The 5% to 10% of revenue rule is useful for established businesses maintaining current customer volume. It breaks down for handyman businesses that are growing, that have a poor lead mix (over-reliant on high-cost platforms), or that have identified specific growth targets that require deliberate investment beyond maintenance spend.
When the Percentage Rule Produces Underspending
A new handyman business doing $60,000 in year-one revenue, applying a 5% rule, would spend $250 per month on marketing. At $250 per month, you cannot run a viable Google Ads campaign, fund a local SEO program, or maintain a lead volume that produces growth. New handyman businesses typically need to invest 10% to 15% of revenue in marketing during their first two years to build the GBP ranking, review base, and lead infrastructure that eventually reduces cost per acquisition. Underspending during the growth phase produces slow growth that extends the period of high acquisition costs. The full handyman lead generation guide covers the investment-phase structure for new and growing businesses.
When the Percentage Rule Produces Overspending on the Wrong Things
A business doing $300,000 per year, applying a 10% rule, spends $2,500 per month on marketing. If $1,800 of that is going to shared platform leads with 12% close rates and no attribution tracking, the business is overspending on low-return channels while potentially underspending on the owned-channel infrastructure (GBP optimisation, local SEO, LSA) that would produce the same or better lead volume at 40% to 60% lower cost per booked job. The right total budget is less important than the right channel allocation within that budget.
The Revenue-Backward Approach to Setting Your Marketing Budget
The most accurate method for setting a handyman business marketing budget starts with your revenue target and works backward to the spending required to hit it.
Step 1: Set Your Monthly Revenue Target
Decide how much monthly revenue you want to generate from marketing-sourced customers (not counting referrals and repeat business, which have near-zero acquisition cost). If you want $15,000 per month in revenue from new customer acquisition and your average job value is $400, you need 37.5 new customer jobs per month from marketing.
Step 2: Calculate the Lead Volume Required
Divide your required new customer jobs by your close rate. If your close rate on your primary lead channels is 35%, you need 37.5 divided by 0.35, which equals 107 leads per month to generate 37.5 booked jobs. If your close rate is only 15% (indicating heavy shared platform reliance), you need 250 leads per month for the same output. This calculation immediately reveals why improving your close rate through better lead sources reduces the lead volume (and therefore the marketing budget) required to hit the same revenue target.
Step 3: Multiply by Your Cost Per Lead by Channel
At 107 leads per month from a mix of GBP (40 leads at $15 effective CPL), Google Ads (40 leads at $55 CPL), and LSA (27 leads at $45 CPL), your monthly marketing spend to hit the revenue target is (40 x $15) + (40 x $55) + (27 x $45) = $600 + $2,200 + $1,215 = $4,015 per month. That is your evidence-based marketing budget based on your revenue target, your close rate, and your CPL by channel. Adjust by channel and volume until you find the allocation that hits your target within your budget constraint. Compare this against the percentage-of-revenue rule: at $300,000 annual revenue, a 10% rule gives $2,500 per month. The revenue-backward approach shows $4,015 is needed to hit a $15,000 monthly new-customer revenue target. The rule would have underfunded the growth goal.
Budget Ranges by Business Stage and Revenue Level
For businesses that want a starting reference point before running the full revenue-backward calculation, the following ranges reflect industry norms for handyman businesses at each stage.
Solo Operator, Under $100,000 Annual Revenue
Budget range: $300 to $800 per month. Priority allocation: GBP optimisation (time investment, minimal money), review generation system ($50 to $100 per month for a review request tool), and Google LSA ($200 to $500 per month for immediate exclusive leads while organic ranking builds). Avoid shared platforms at this stage: the percentage of revenue consumed by per-lead fees at low volume is disproportionately high.
Growing Business, $100,000 to $300,000 Annual Revenue
Budget range: $800 to $2,500 per month. Priority allocation: Local SEO ($700 to $1,200 per month to build organic rankings), Google Ads or LSA ($500 to $900 per month for immediate lead volume while SEO matures), and CRM and tracking tools ($100 to $200 per month). This stage is where the paid-to-organic transition should be actively managed. The local SEO vs. paid leads cost guide provides the 24-month cost trajectory to inform this transition.
Established Business, $300,000 or More Annual Revenue
Budget range: $2,000 to $5,000 or more per month, depending on growth target. Priority allocation: A mature SEO program generating 50% or more of lead volume at the lowest cost per lead, Google Ads targeting high-value specific services (emergency repairs, large projects, specialty work), LSA for immediate-intent capture, and a systematic review program that maintains the review velocity that keeps GBP and LSA performing at benchmark. At this stage, shared platform dependency should be eliminated or minimised to specific service types where platform leads convert at acceptable close rates.
How to Evaluate Whether Your Current Spend Is Producing the Right Return
Budget size is only meaningful if the spending is producing an acceptable return. The evaluation framework is cost per booked job by channel compared against your maximum justifiable acquisition cost.
Calculating Your Maximum Justifiable Marketing Spend Per Job
Maximum justifiable marketing spend per job = Average job revenue multiplied by your target gross margin percentage minus your non-marketing variable costs per job. If your average job generates $420 in revenue, your target gross margin is 35%, and your variable non-marketing costs per job (materials, subcontractor, if any) are $60, your gross profit per job before marketing is $420 multiplied by 0.35 minus $60 = $87. That $87 is the maximum you can spend to acquire a job and still hit your target margin. If your current cost per booked job from any channel exceeds $87, that channel is either destroying your margin or forcing you to accept below-target margin to remain competitive.
When to Increase vs. Decrease Your Budget
Increase your budget when your cost per booked job is below your maximum justifiable level, and you have available capacity (the jobs would fill your schedule rather than exceed it). Decrease your budget when your cost per booked job exceeds your maximum justifiable level, but only after confirming that the problem is the channel rather than your follow-up process. If increasing the budget on a channel where your cost per booked job is excellent would produce more jobs than you can currently complete, address the capacity constraint (hiring, crew expansion) before increasing spend. Spending more to generate leads you cannot service damages your reputation and wastes budget.
How Inshalytics Helps Handyman Businesses Set and Manage Marketing Budgets
Inshalytics builds handyman marketing budgets backward from revenue targets using the methodology in this guide. We calculate the lead volume required, estimate the CPL by channel for your specific market, set the channel allocation that minimises cost per booked job, and establish the tracking infrastructure that confirms whether the actual results match the projections. Monthly reporting shows cost per booked job by channel against the target, with budget reallocation recommendations when any channel drifts outside its acceptable range.
Want to know the right marketing budget for your handyman business based on your specific revenue target and market? Talk to Inshalytics about a budget calculation specific to your numbers.