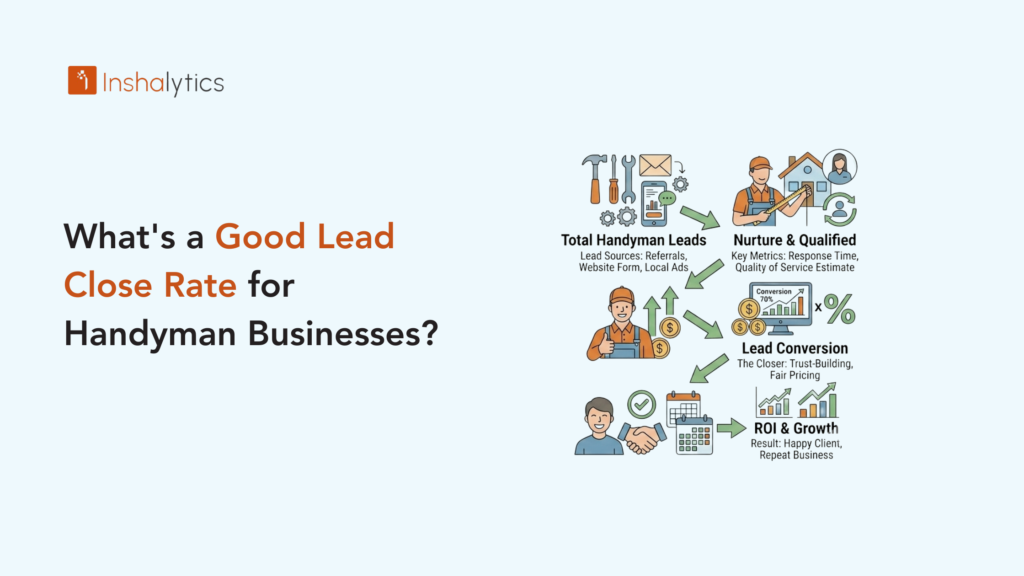
Your close rate is the percentage of leads that turn into booked jobs. It is the single most undertracked metric in handyman marketing, and it is the number that determines whether your marketing budget is working or leaking. A 20% close rate means one in five leads becomes a job. A 40% close rate from the same lead volume means two in five. On 40 leads per month, that is the difference between 8 jobs and 16 jobs from identical marketing spend. No other single improvement in your marketing or sales process produces a bigger change in revenue without increasing what you spend. This guide covers what a good close rate looks like for a handyman business, what moves the number up or down, and how to diagnose the specific problem when your rate is below benchmark.
What Is a Good Lead Close Rate for a Handyman Business?
The short answer is: it depends on your lead source, because close rate is primarily determined by lead exclusivity and lead intent, not by sales skill. The benchmarks below reflect industry data for handyman businesses in the US market.
Close Rate Benchmarks by Lead Source
GBP inbound calls (homeowner found your listing, chose to call): 35% to 55%. Website or direct traffic inbound calls: 35% to 50%. Google LSA leads: 30% to 50% for businesses with 40 or more reviews. Google Ads inbound calls: 25% to 40%, depending on keyword intent and landing page quality. Shared platform leads (Angi, Thumbtack, HomeAdvisor): 8% to 18%. Referrals from existing customers: 55% to 75%. Emergency or urgent service requests from any channel: 45% to 65%. These ranges reflect businesses with functional follow-up processes. If your contact rate (the percentage of leads you actually reach) is below 70%, your effective close rate on leads reached will appear higher, but your rate on leads received will be depressed by the unreached contacts.
Why Your Lead Source Determines More of Your Close Rate Than Your Sales Process
A handyman business owner with strong sales skills, calling back a shared platform lead, competes against four other contractors who received the same contact simultaneously. A handyman business owner with average sales skills, calling back a GBP-sourced lead speaks to a homeowner who has already chose their business from the local search results. The second scenario produces a higher close rate regardless of sales ability because the intent and exclusivity differences are more powerful than sales skill differences. This is why improving your lead sources is a higher-leverage investment than improving your pitch. Better lead sources raise your floor. Better sales skills raise your ceiling. Start with the floor.
The Blended Close Rate and What It Tells You
Your blended close rate (total jobs booked divided by total leads received across all sources) is your headline number. But the blended rate can hide significant variation between sources. A business with a 22% blended close rate might have a 45% close rate on GBP leads and a 9% close rate on platform leads. The blended number makes the business look like it has a sales process problem. The source breakdown reveals that the GBP channel is performing excellently, and the platform channel is dragging the average down. Tracking close rate by source is the analysis that produces actionable decisions. The lead source tracking guide covers the setup required to generate this breakdown.
What Pulls Your Close Rate Below Benchmark
When close rate falls below the benchmark for a given source type, the cause almost always falls into one of four categories: follow-up timing, follow-up frequency, pricing expectations mismatch, or lead quality issues that pre-callback screening should have caught.
Follow-Up Timing: The Five-Minute Rule
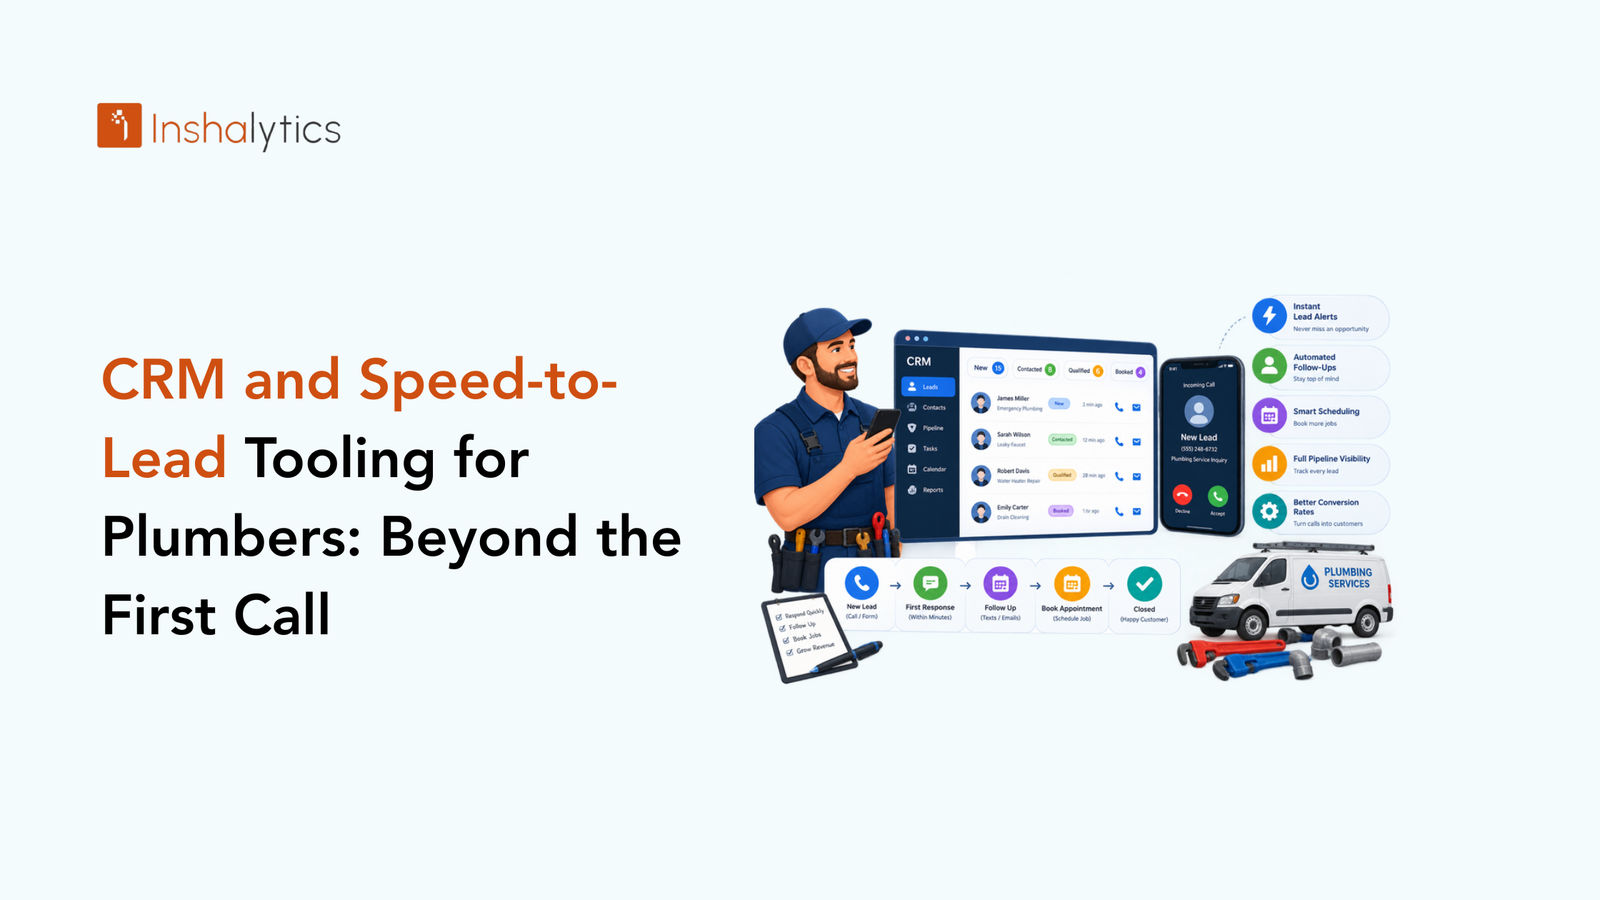
Research on lead response time across home service industries consistently shows that contacting a lead within five minutes of their inquiry makes you 21 times more likely to connect than waiting 30 minutes, and the difference between five minutes and one hour is statistically more impactful than any other single conversion variable. For shared platform leads where four other contractors received the same contact simultaneously, speed to callback is existential: if you are third to call, the homeowner has already formed a preference before your conversation starts. For exclusive inbound leads, a five-minute callback is still the standard, but the urgency is somewhat lower because the homeowner is not simultaneously fielding calls from competitors. Use your CRM automation to send an immediate text to any lead that arrives when you cannot call back, bridging the gap between lead arrival and your first voice contact.
Follow-Up Frequency: Most Handymen Stop Too Early
Industry data shows that most sales conversions from initial inquiries happen on follow-up attempts two through five, not on the first contact. Most handyman businesses make one or two callback attempts and then abandon the lead. A lead who did not answer on attempt one is not a dead lead. They may have been on another call, driving, or at work. A systematic follow-up sequence of five attempts over five days (call on day one, text on day one if no answer, call on day two, text on day three, final call or voicemail on day five) contacts the vast majority of genuinely interested leads who simply missed the initial attempt. Automate this sequence in your CRM rather than relying on memory.
Pricing Expectation Mismatches That Kill Estimates
If homeowners consistently respond to your estimate with surprise at the price and decline to proceed, your close rate problem is a pricing expectation mismatch, not a sales process failure. The homeowner came to the call with a price expectation shaped by internet research that may not reflect current market rates or your specific pricing. Addressing this before the estimate by briefly mentioning a price range during the qualification call (“Jobs like that typically run $175 to $350, depending on what I find on-site”) sets the expectation before a site visit is invested. The handyman pricing strategy guide covers the full approach to quote presentation that maintains close rates while protecting your rates.
How to Calculate and Track Your Close Rate
Close rate tracking requires one piece of data you probably already have (jobs booked) and one you may not be tracking consistently (total leads received by source). Here is the minimum tracking setup required.
The Simple Close Rate Formula
Close Rate = Jobs Booked divided by Leads Received, multiplied by 100. Count every inbound contact as a lead: phone calls from tracked numbers, form submissions, text inquiries, and platform notifications. Count only jobs where a customer showed up, and work was completed as booked jobs (not estimates given, not deposits received that were later cancelled). Track this monthly by source. After 90 days, you have enough data to compare your close rate by source against the benchmarks in this guide.
Contact Rate vs. Close Rate: Two Numbers You Need
Contact rate is the percentage of leads where you successfully reached the homeowner by phone or text. Close rate is the percentage of leads that became jobs. Both matter, and they diagnose different problems. If your contact rate is 60% and your close rate is 18%, you have a follow-up problem (40% of your leads are being left unreached) rather than a sales process problem. If your contact rate is 85% and your close rate is still 18%, the problem is in the conversation itself: pricing expectations, qualification failures, or genuine lead quality issues. Calculate both numbers separately to identify which problem you are actually solving.
How to Improve Your Close Rate Without Spending More on Leads
Close rate improvement is the highest-leverage marketing investment because it increases revenue from your existing lead volume without requiring additional spend on lead acquisition.
Building Your Review Base to Improve Pre-Call Trust
A homeowner who calls back after seeing your 4.8-star rating and 65 reviews on your GBP has already begun the trust-building process before the conversation starts. They are less likely to ask “how do I know you do good work?” and more likely to ask “when can you come out?” Review count and star rating are the most powerful pre-conversation trust signals available to a handyman business, and they directly influence close rate on every exclusive inbound channel. The five-star review system covers how to generate reviews consistently enough to build and maintain the review profile that converts at the top of the close rate benchmark range.
Optimising Your Minimum Fee Communication
Stating your minimum service fee early in the callback call eliminates the close rate damage caused by homeowners who agree to an estimate and then object to the price only after you have driven out. Add your minimum fee to your GBP description, your website service pages, and your callback script. Homeowners who object to your minimum on the phone save you the estimate trip. Homeowners who accept your minimum on the phone arrive at the estimate pre-qualified on price. Either outcome is better than investing an estimated visit in a homeowner who was never going to accept your rates.
How Inshalytics Improves Handyman Business Close Rates
Inshalytics improves close rates for handyman clients through two parallel workstreams. On the lead quality side, we build the owned-channel infrastructure (GBP, local SEO, LSA, converting website) that generates leads with higher baseline intent and exclusivity, raising the structural close rate ceiling. On the process side, we set up CRM automation that ensures every lead receives a five-minute text acknowledgement, a structured five-attempt follow-up sequence, and a referral source tag in your practice management system so that close rate by source is trackable from day one.
Is your close rate below the benchmark? Talk to Inshalytics about a lead quality and process audit that identifies whether the problem is your sources, your follow-up, or your pricing approach.